Zabbix Monitor Service Status Windows
As a Windows system administrator, monitoring the service status of your servers is crucial for ensuring their optimal performance and availability. One powerful tool you can use for this purpose is Zabbix, an open-source monitoring solution that provides real-time insights into the health of your IT infrastructure.
In this article, we will explore how you can leverage Zabbix to monitor service status on Windows servers effectively.
Setting Up Zabbix Agent on Windows Server
The first step in monitoring service status on Windows servers with Zabbix is to install and configure the Zabbix Agent software. The Zabbix Agent is a lightweight daemon that runs on the target Windows server and collects various metrics, including service status information, which it sends to the Zabbix server for processing.
You can download the Zabbix Agent installer for Windows from the official Zabbix website and follow the on-screen instructions to complete the installation. Once installed, you need to configure the Zabbix Agent to connect to your Zabbix server by editing the zabbix_agentd.conf file and specifying the server IP address or hostname.
After configuring the Zabbix Agent, restart the service to apply the changes, and you should see the Windows server listed as a monitored host in the Zabbix web interface.
Creating Service Status Items in Zabbix
Once the Zabbix Agent is set up on the Windows server, you can start creating service status items to monitor specific services on the server. In the Zabbix web interface, navigate to the host configuration page for the Windows server and click on the “Items” tab.
Click on the “Create Item” button and fill in the required fields, including the item key, name, and type. To monitor the service status of a Windows service, you can use the following item key: service.info[service name].
Once you have created the service status item, you can configure triggers to alert you when the service status changes, thresholds are exceeded, or other conditions are met. This allows you to take proactive steps to address any service issues before they impact the performance of your Windows server.
Visualizing Service Status Data in Zabbix
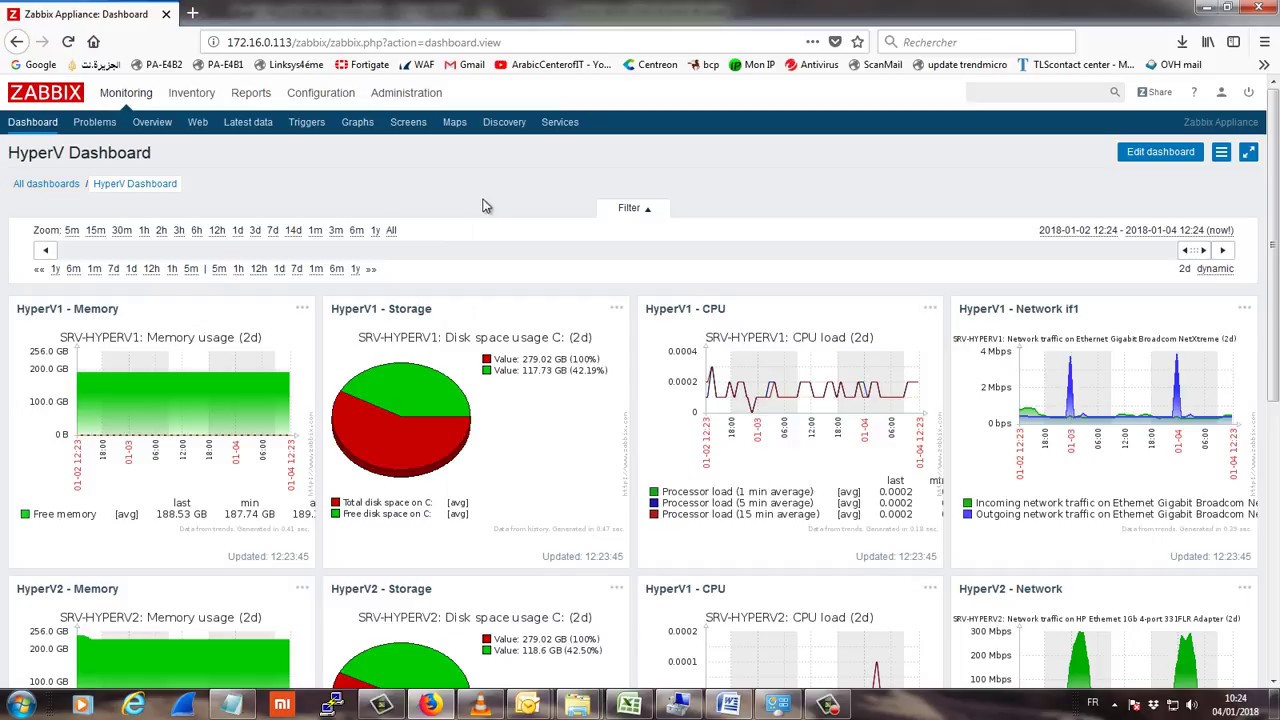
Zabbix provides powerful visualization features that allow you to create graphs, charts, and dashboards to monitor and analyze service status data over time. By creating custom dashboards in the Zabbix web interface, you can quickly identify trends, anomalies, and correlations in your service status metrics.
With Zabbix’s customizable reporting capabilities, you can generate detailed reports on service status trends, performance metrics, and uptime statistics for your Windows servers. These reports can help you make informed decisions about optimizing your IT infrastructure and improving service reliability.
Conclusion
Monitoring service status on Windows servers with Zabbix is essential for maintaining the health and performance of your IT infrastructure. By leveraging Zabbix’s monitoring and visualization capabilities, you can gain valuable insights into your service status data and take proactive steps to ensure your Windows servers are running smoothly.
Start monitoring service status on your Windows servers with Zabbix today and experience the benefits of real-time monitoring and proactive troubleshooting.
