How to Monitor Windows Server with Zabbix
If you are a system administrator responsible for managing a Windows server, you know the importance of monitoring its performance and health. Monitoring tools such as Zabbix can help you keep a close eye on your server’s metrics, detect issues early, and ensure optimal performance. In this article, we will guide you on how to monitor your Windows server using Zabbix.
What is Zabbix?
Zabbix is an open-source monitoring software that allows you to monitor the performance and availability of network devices, servers, and other IT resources. It can collect and analyze data from a wide range of devices, making it a versatile tool for system administrators.
Setting up Zabbix Server
The first step in monitoring your Windows server with Zabbix is setting up the Zabbix server. You can follow the official documentation to install and configure the Zabbix server on a Linux machine. Once the server is up and running, you can proceed to configure monitoring for your Windows server.
Installing Zabbix Agent on Windows Server
To monitor a Windows server with Zabbix, you need to install the Zabbix agent on the server. The Zabbix agent is a lightweight program that runs on the Windows server and collects data on behalf of the Zabbix server. You can download the Zabbix agent installer from the official Zabbix website and follow the installation instructions to set it up on your Windows server.
Configuring Zabbix Agent
Once the Zabbix agent is installed on your Windows server, you need to configure it to communicate with the Zabbix server. Edit the Zabbix agent configuration file and specify the IP address or hostname of the Zabbix server, as well as any required authentication settings. Make sure that the Zabbix agent is running as a Windows service so that it starts automatically on server boot.
Setting Up Items and Triggers
After configuring the Zabbix agent, you can start setting up items and triggers to monitor your Windows server. Items represent individual metrics that you want to monitor, such as CPU usage, memory usage, disk space, etc. Triggers allow you to define conditions that will trigger an alert if a certain threshold is reached. By setting up items and triggers, you can create a comprehensive monitoring system for your Windows server.
Visualizing Data with Zabbix
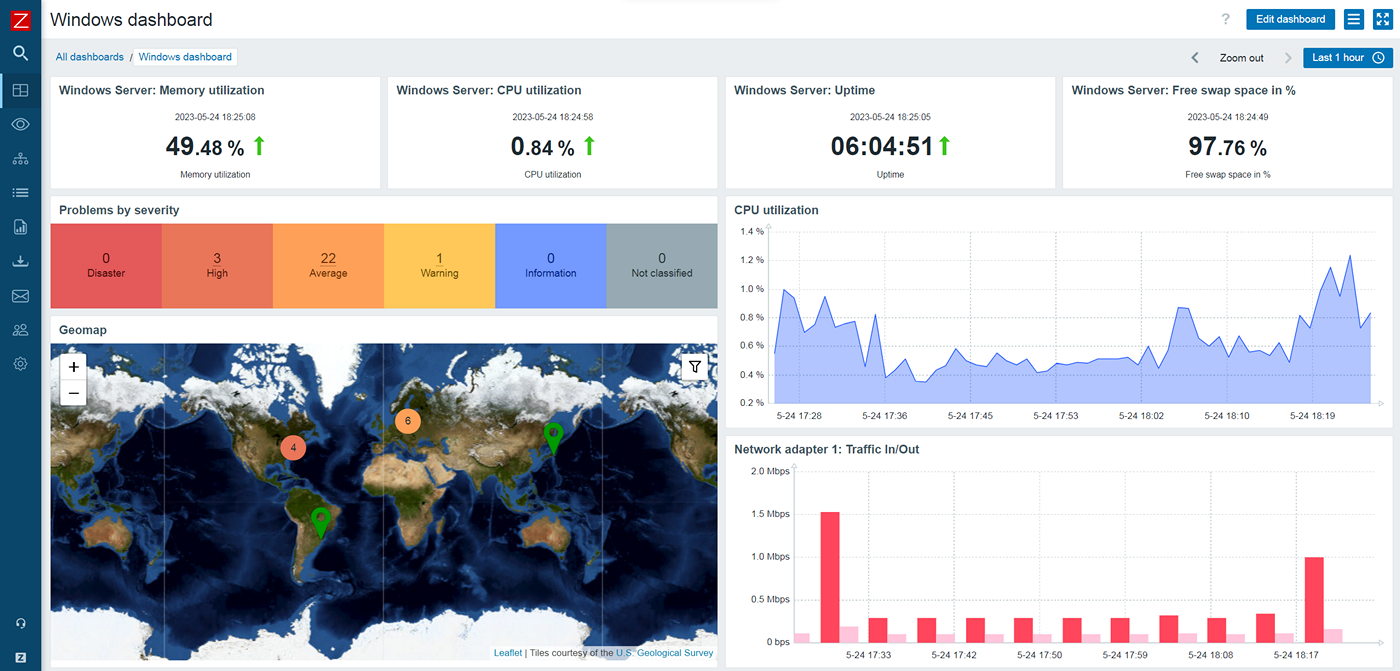
Once you have set up monitoring for your Windows server, you can visualize the collected data using the Zabbix web interface. Zabbix provides a variety of built-in graphs and dashboards that allow you to monitor the performance and health of your server in real-time. You can also create custom dashboards to display specific metrics that are important to you.
Setting Up Notifications
To ensure that you are alerted to any issues with your Windows server, you can set up notifications in Zabbix. Notifications can be configured to send email alerts, SMS alerts, or even execute custom scripts in response to specific triggers. By setting up notifications, you can stay informed about the status of your server and take timely actions to resolve any issues.
Conclusion
Monitoring your Windows server with Zabbix can help you keep your server running smoothly and minimize downtime. By following the steps outlined in this article, you can set up a comprehensive monitoring system for your Windows server and ensure that it remains in optimal condition. Remember to regularly review and update your monitoring configuration to adapt to changing requirements and maintain the health of your server.
