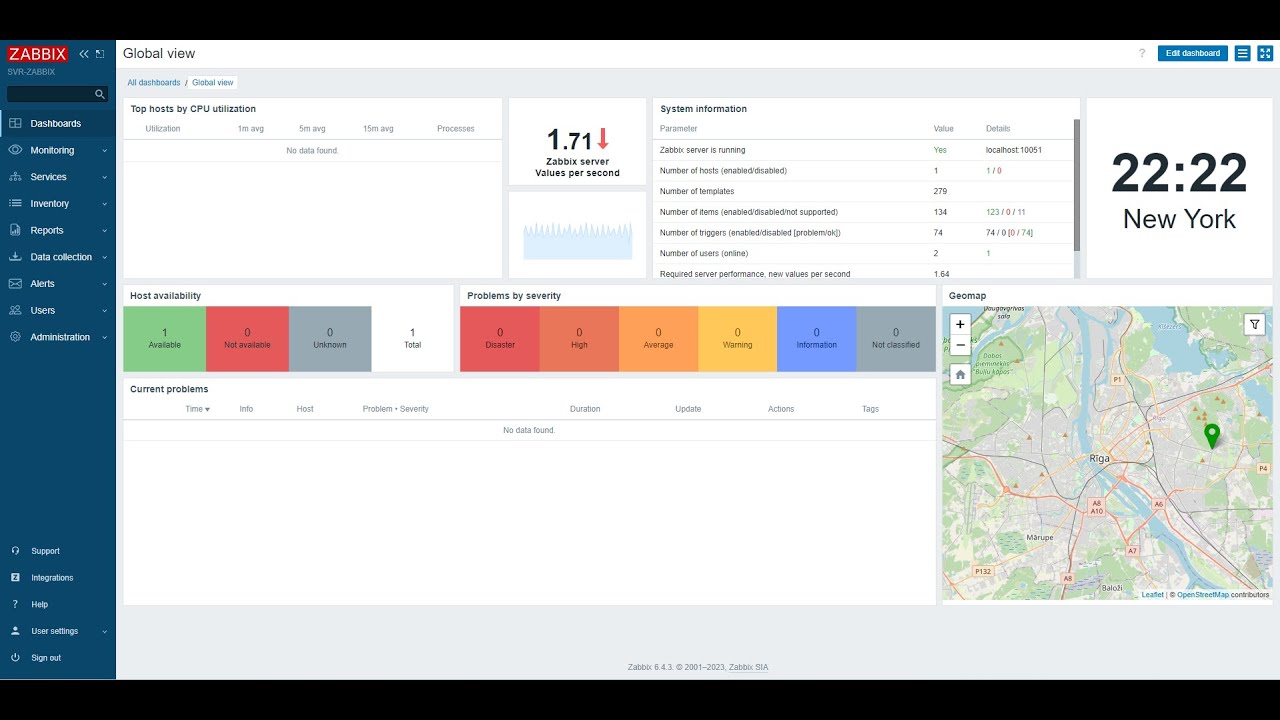
How to Monitor Your Website Using Zabbix
If you own a website, ensuring it is running smoothly and efficiently is crucial for its success. Monitoring your website regularly can help you identify and address any issues before they escalate. Zabbix is a powerful open-source monitoring solution that can help you keep an eye on your website’s performance and health. In this article, we will show you how to monitor your website using Zabbix.
Step 1: Install Zabbix
The first step in monitoring your website using Zabbix is to install the Zabbix server on a machine of your choice. You can install Zabbix on a dedicated server or a virtual machine. Follow the installation instructions provided on the Zabbix website to set up the server successfully.
Step 2: Configure Zabbix Server
Once you have installed Zabbix, you will need to configure the server to start monitoring your website. Login to the Zabbix web interface and navigate to the “Configuration” tab. Here, you can add hosts, set up triggers, create actions, and configure user permissions.
Step 3: Add Website to Monitoring
After configuring the Zabbix server, you can add your website to the monitoring list. Click on “Configuration” and then select “Hosts.” Click on “Create Host” and fill in the necessary details such as hostname, IP address, and other relevant information about your website.
Step 4: Set Up Monitoring Items
Once you have added your website to the monitoring list, you can start setting up monitoring items. Monitoring items are elements that Zabbix will monitor on your website, such as CPU usage, memory usage, disk space, and network traffic. Configure these items based on your website’s requirements.
Step 5: Create Triggers
Triggers in Zabbix are conditions that, when met, will generate an alert. Create triggers for critical parameters on your website, such as high CPU usage or low disk space. This will help you identify issues quickly and take corrective actions.
Step 6: Monitor Website Performance
Once you have configured monitoring items and triggers, you can start monitoring your website’s performance in real-time. The Zabbix dashboard will display relevant metrics and alerts, allowing you to assess your website’s health and performance at a glance.
Step 7: Take Corrective Actions
If Zabbix alerts you to any issues with your website, it’s essential to take corrective actions promptly. Investigate the root cause of the problem and implement solutions to ensure your website runs smoothly. Regularly review monitoring data to prevent future issues.
By following these steps, you can effectively monitor your website using Zabbix and ensure it remains operational and efficient. Remember that regular monitoring and maintenance are key to a successful website. Utilize Zabbix’s robust monitoring capabilities to keep your website in top condition.
