How to Monitor Oracle Database Performance in Linux
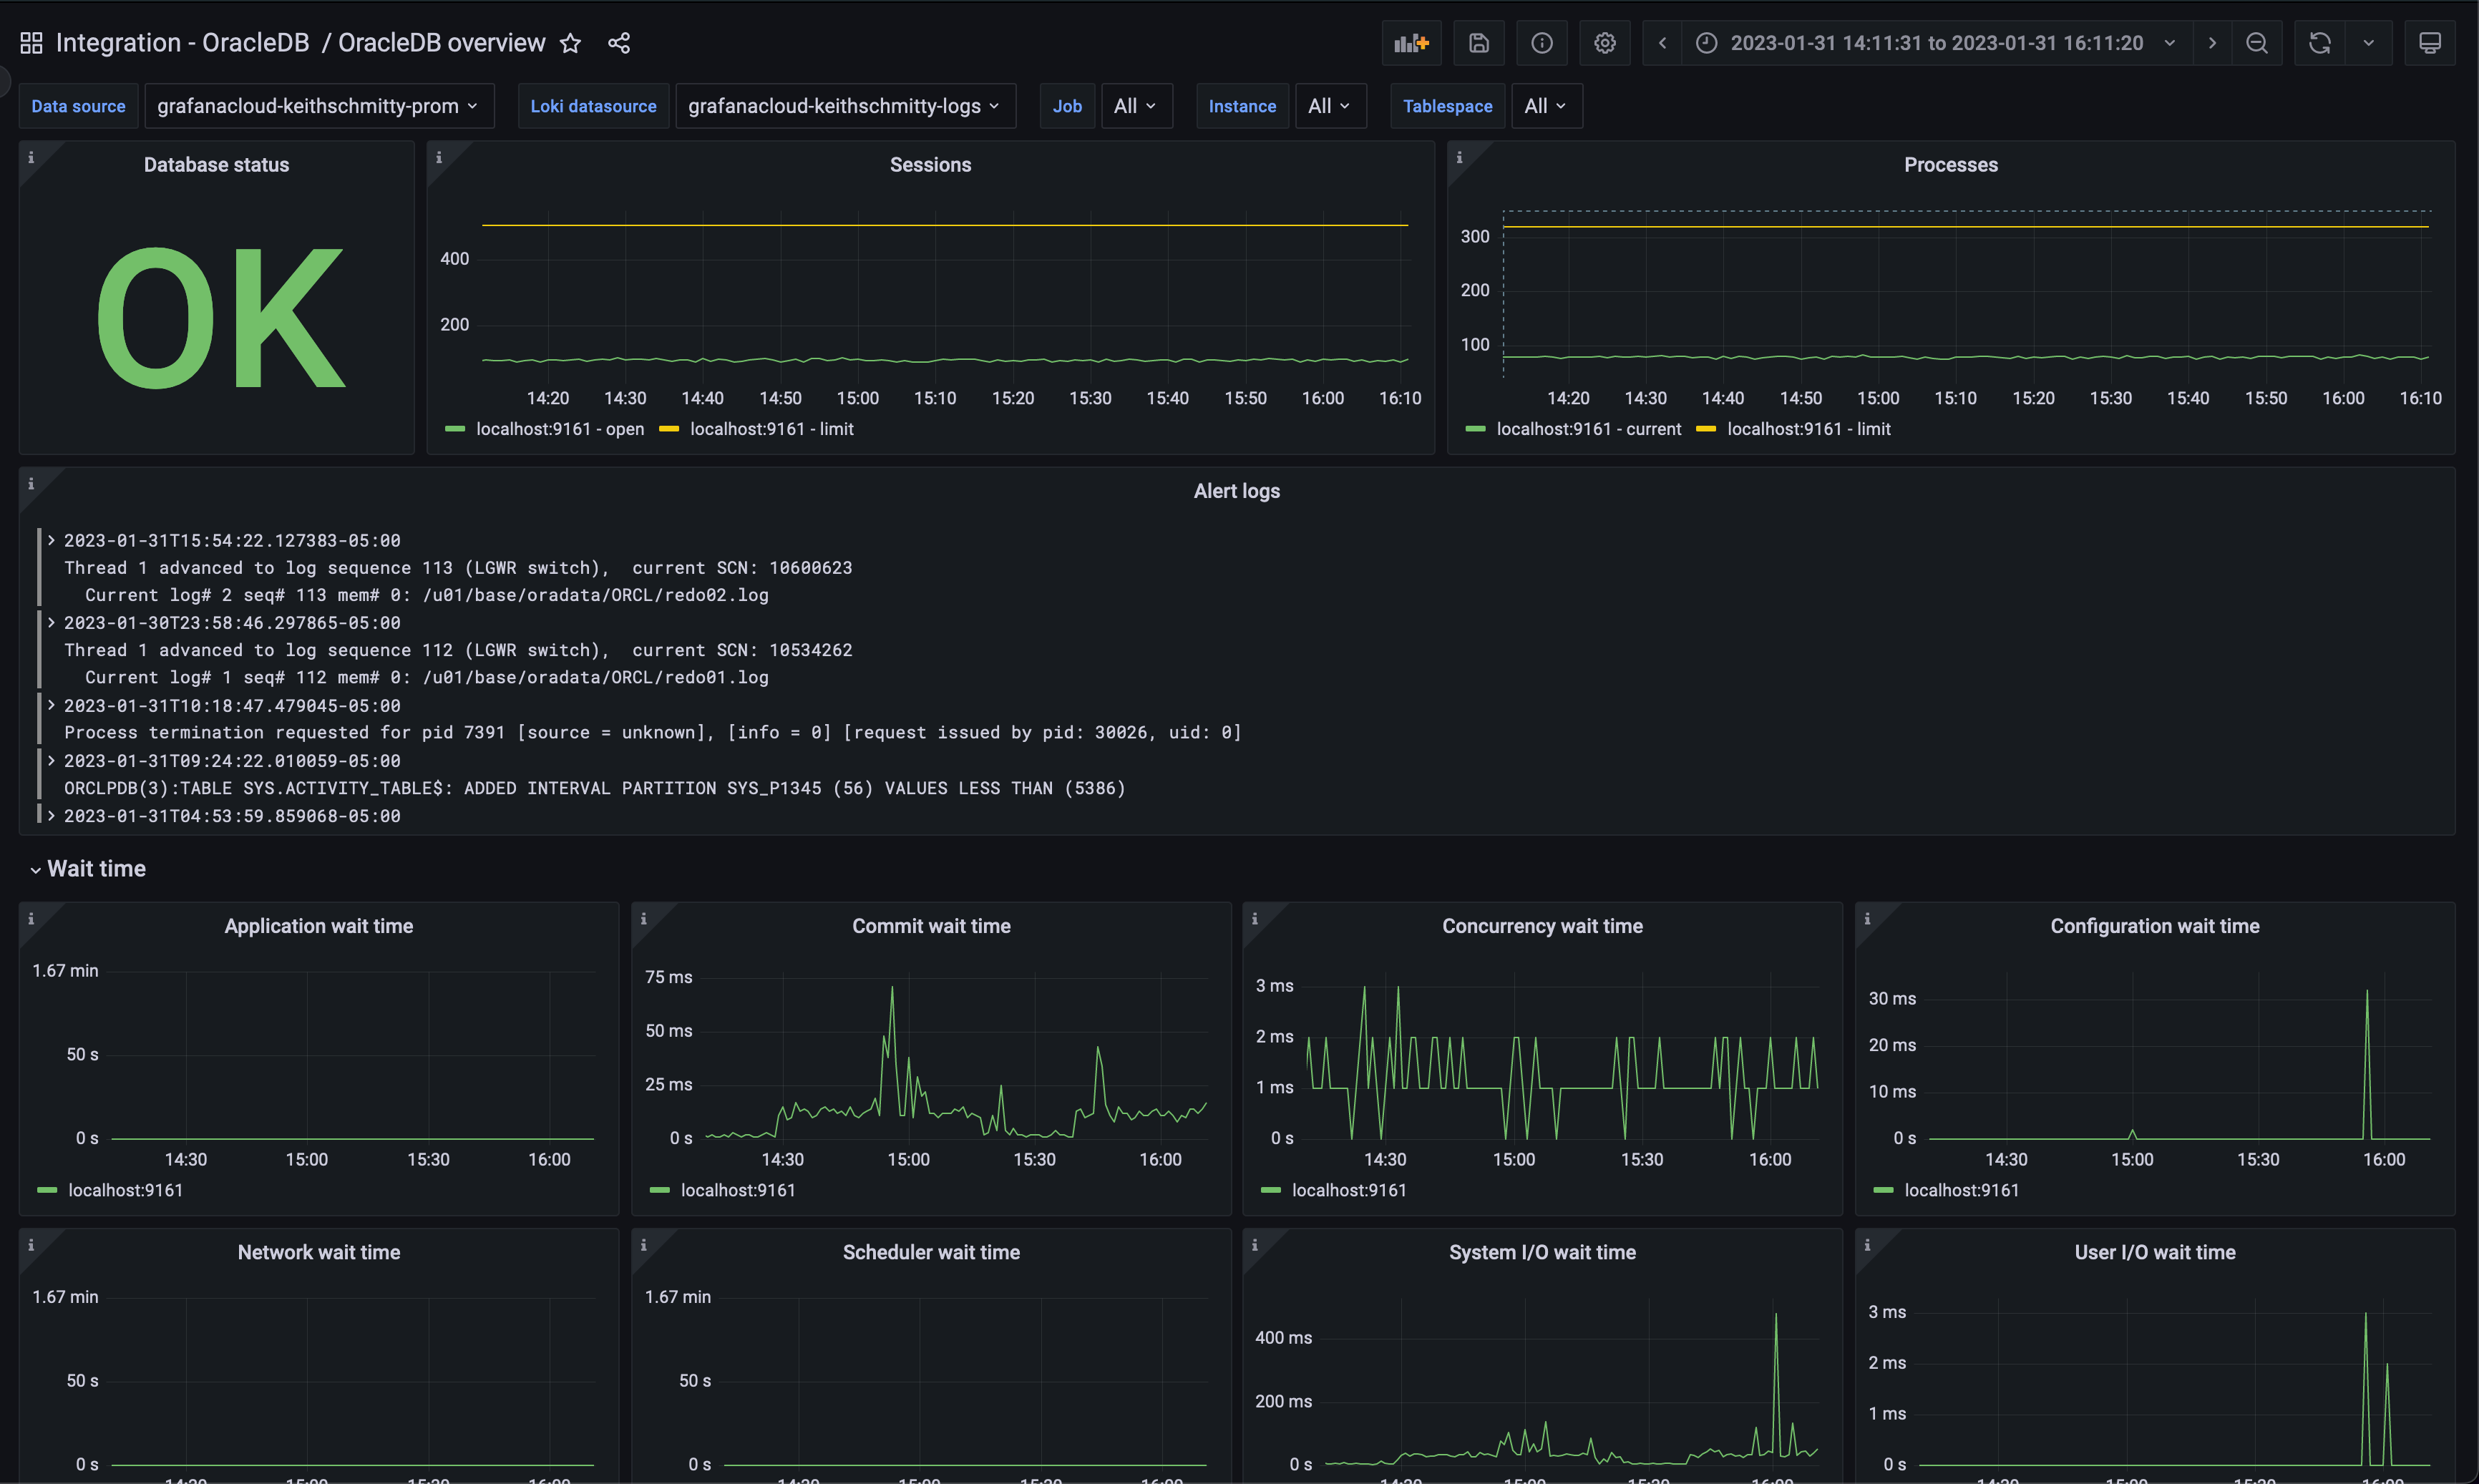
Monitoring the performance of an Oracle database in a Linux environment is crucial for ensuring its optimal operation. By keeping track of various metrics and performance indicators, you can identify potential issues early on and take proactive steps to address them. In this article, we will discuss some essential tools and techniques that you can use to monitor the performance of your Oracle database on a Linux system.
1. Oracle Enterprise Manager (OEM)
Oracle Enterprise Manager (OEM) is a comprehensive management tool that allows you to monitor and manage your Oracle database environment. With OEM, you can view performance metrics, real-time status, and historical trends of your database instances. It also provides alert notifications for critical events, allowing you to take immediate action when needed.
2. Oracle Performance Management Pack (PMP)
The Oracle Performance Management Pack (PMP) is a set of tools that help you analyze and optimize the performance of your Oracle database. PMP includes features such as performance monitoring, tuning advisors, and SQL monitoring capabilities. With PMP, you can identify performance bottlenecks, tune SQL queries, and improve the overall performance of your database.
3. Oracle Automatic Workload Repository (AWR)
The Oracle Automatic Workload Repository (AWR) is a built-in feature of Oracle databases that collects and stores performance statistics for your database. AWR provides detailed reports on various performance metrics, including SQL statements, wait events, and system statistics. By analyzing AWR reports, you can identify performance trends and potential areas for optimization.
4. Oracle Statspack
Oracle Statspack is another performance monitoring tool that provides detailed performance reports for your database. Statspack collects performance data over a period of time and generates reports that help you identify performance bottlenecks and trends. By using Statspack, you can proactively monitor and optimize the performance of your Oracle database.
5. Oracle Trace File Analyzer (TFA)
Oracle Trace File Analyzer (TFA) is a diagnostic tool that helps you troubleshoot performance issues in your Oracle database. TFA collects diagnostic information, such as log files and trace files, and analyzes them to identify potential issues. By using TFA, you can quickly diagnose and resolve performance problems in your Oracle database.
6. Linux System Monitoring Tools
In addition to Oracle-specific tools, you can also use various Linux system monitoring tools to monitor the performance of your Oracle database server. Tools such as top, sar, vmstat, and iostat provide valuable insights into system resource usage, CPU performance, disk I/O, and memory usage. By tracking these metrics, you can ensure the smooth operation of your Oracle database on a Linux system.
7. Custom Scripts and Monitoring Solutions
Finally, you can create custom scripts or use third-party monitoring solutions to monitor the performance of your Oracle database in a Linux environment. Custom scripts can be tailored to collect specific performance metrics or generate custom reports based on your requirements. Similarly, third-party monitoring solutions offer advanced features and integrations that can enhance your database monitoring capabilities.
By utilizing a combination of Oracle-specific tools, Linux system monitoring tools, and custom solutions, you can effectively monitor the performance of your Oracle database in a Linux environment. Regular monitoring and analysis of performance metrics will help you identify and address performance issues proactively, ensuring the optimal operation of your database.
